
Your analytics tool shows a steep drop-off at step three of onboarding. Half the users who start your activation flow never complete it. A segment of trial accounts hasn't touched your core feature in two weeks.
You know all of this. You can see it clearly in your dashboard.
And then what?
You export a CSV. You open your onboarding tool. You try to remember which segment maps to which condition. You file a ticket. You wait. By the time a fix is live, the data is a week old and the moment has passed.
So why isn't anything changing?
Because seeing the problem and fixing it live in two different systems. And the gap between them is where momentum dies.
This is the hidden cost of running analytics and in-app experiences as two separate systems. It's not a data problem—most teams have plenty of data. It's a what do we do with it problem. And it compounds every day the gap stays open.
Key Takeaways
- Most teams use separate tools for product analytics and in-app experiences—and the gap between them stalls activation.
- Product Adoption Insights brings no-code event tracking, funnel analysis, and segmentation into Userflow—the same platform you use to build in-app flows.
- Go from identifying funnel drop-off to launching a fix in minutes, not weeks.
- Available today on all Userflow plans.
Your Analytics Tool Shows You What's Broken. It Can't Fix It.
The standard product stack for a growth or product team looks something like this: an event tracking layer, a standalone analytics tool for charts and funnels, and a separate platform for building in-app guides, tours, and onboarding flows.
The real work that moves adoption metrics happens in the handoff. Someone has to interpret the data, translate it into a hypothesis, build an experience, target the right segment, and ship it. That process takes days, sometimes weeks. Here's what that handoff actually looks like:
- Analytics flags a drop-off
- Someone forms a hypothesis
- A Slack message becomes a ticket
- A developer builds or instruments a fix
- Fix goes live—days or weeks later
- The cohort has already churned or converted
- That delay isn't a process problem. It's a structural one.
And it requires at least two platforms, often three, and usually a shared Slack thread that gets buried.
Because the tool that shows you the drop-off and the tool you use to fix it are two different products—and there's no native connection between them.
The insight and the action are disconnected by design. And the longer they stay disconnected, the more activation stalls, retention slips, and at-risk accounts go unnoticed until it's too late.
What Happens When Product Analytics and Adoption Are the Same System?
Imagine instead that the funnel showing your drop-off and the tool you use to fix it are the same system.
You see that 40% of trial users abandon your setup flow at step three. You don't export a CSV and switch tabs. Instead, you use that same view to identify the cohort, build a targeted guide that addresses exactly that friction point, and launch it to exactly those users—all without leaving Userflow.
Or your chart shows that users on the Starter plan are barely engaging with your most valuable feature. You group the data by plan type, confirm the pattern, export that user list directly from the chart, and trigger a personalized in-app nudge before they reach the end of their trial.
That's not a hypothetical.
That's the workflow Product Adoption Insights makes possible. The full suite is live for every Userflow customer today.
What's Included in Product Adoption Insights?
Product Adoption Insights is a suite of no-code analytics tools built directly into Userflow—the same platform teams already use to build in-app experiences. Here's what's included:
No-Code Event Tracking
Capture behavioral data by clicking elements directly inside your product. No engineers, no tickets, no waiting for instrumentation to catch up with your questions. Events immediately power charts, funnels, segmentation, and personalization the moment they're created.
Chart Builder
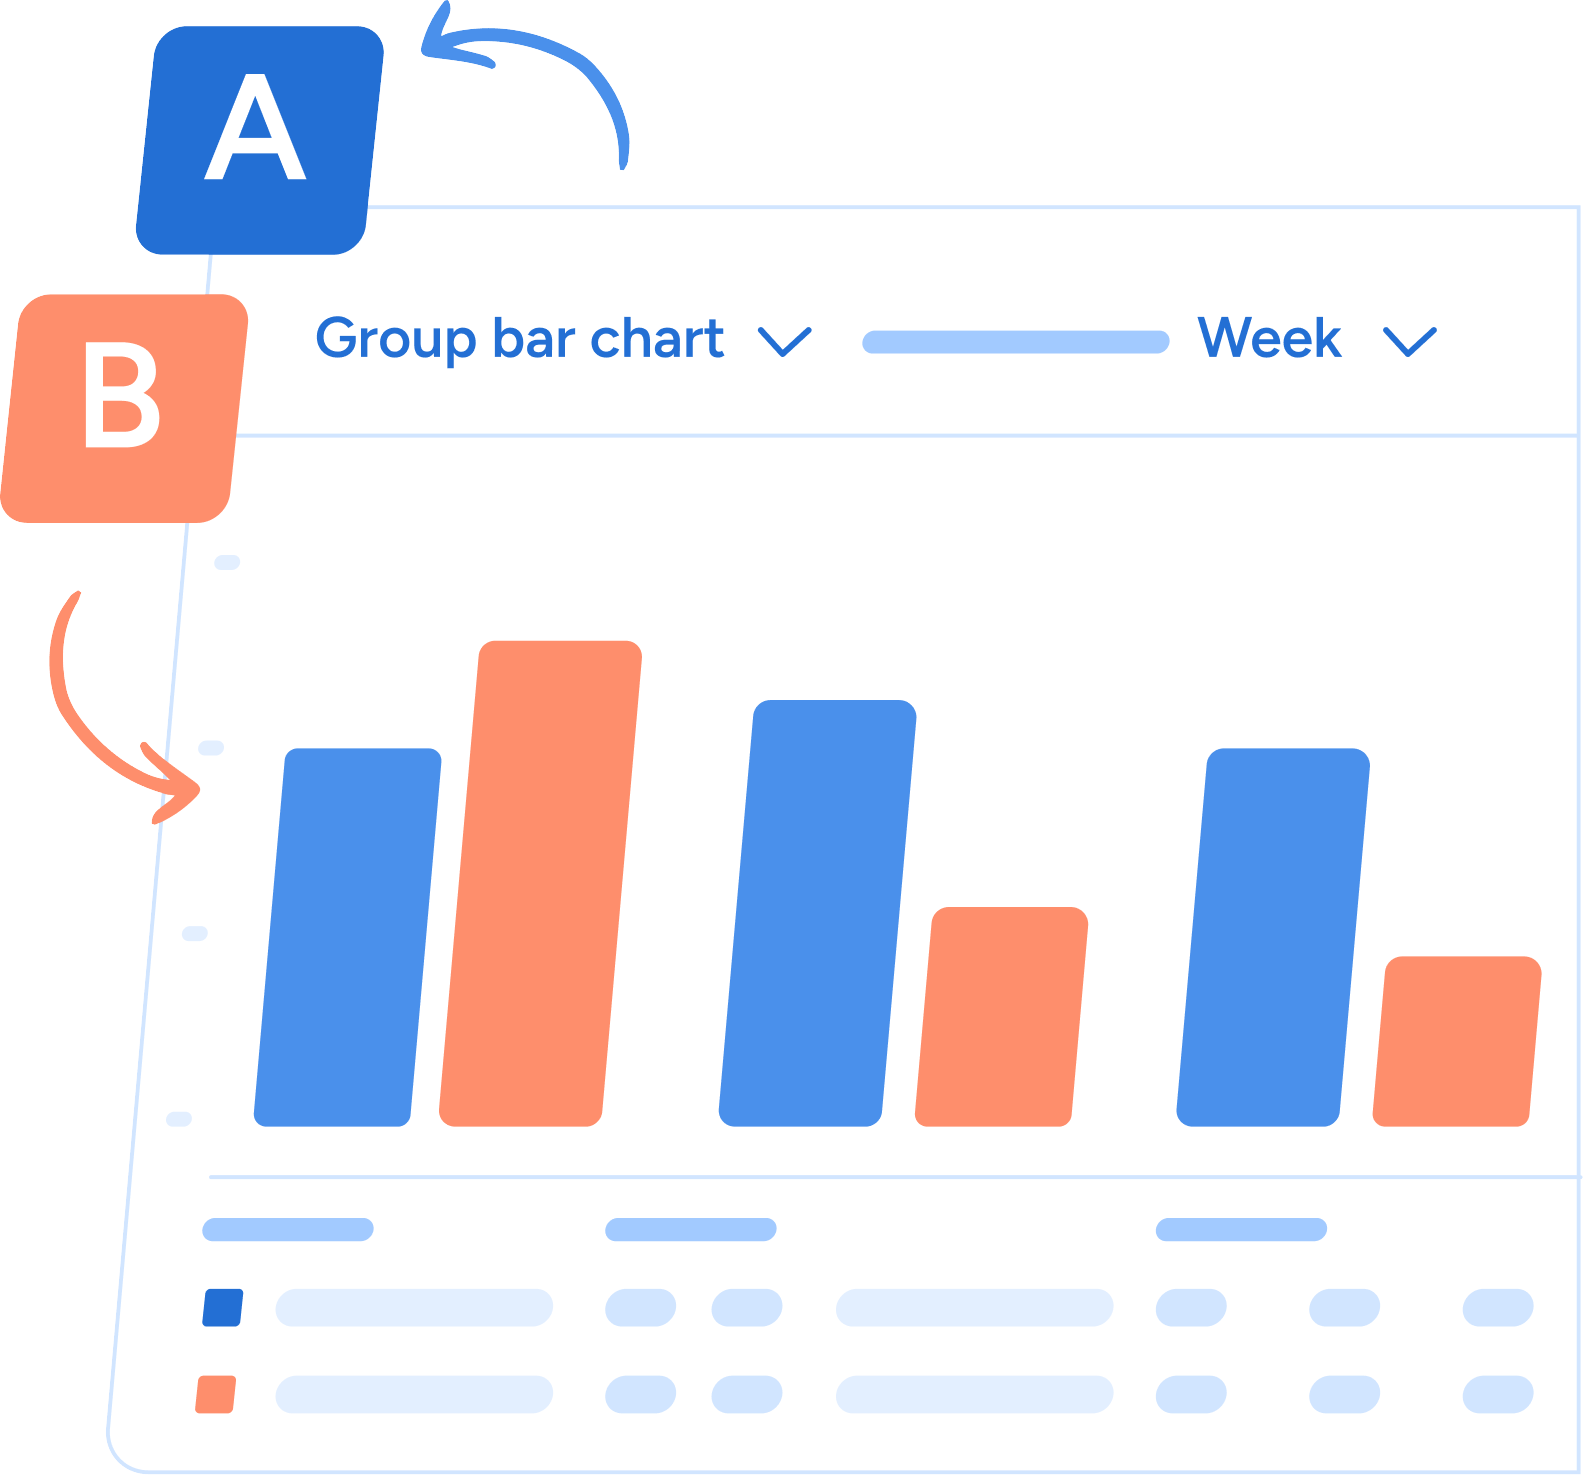
Build custom charts to explore usage trends, feature adoption, and behavioral patterns across users and companies. Flexible enough to answer one-off questions fast; structured enough to pin to a shared dashboard. No analyst or SQL required.
Group-by Analysis
This is the capability that completes the suite—and the one that transforms raw event data into real business intelligence.
Group-by Analysis lets you break down any chart or funnel by user or account attributes: plan type, subscription status, or any user or account attribute you track. Instead of seeing aggregate numbers, you see which users are activating, which segments are dropping off, and which cohorts respond to onboarding experiences.
The difference between "30% of users complete this flow" and "30% of trial users complete this flow, versus 78% of paid users" is the difference between a data point and a decision. Group-by is what gets you there.
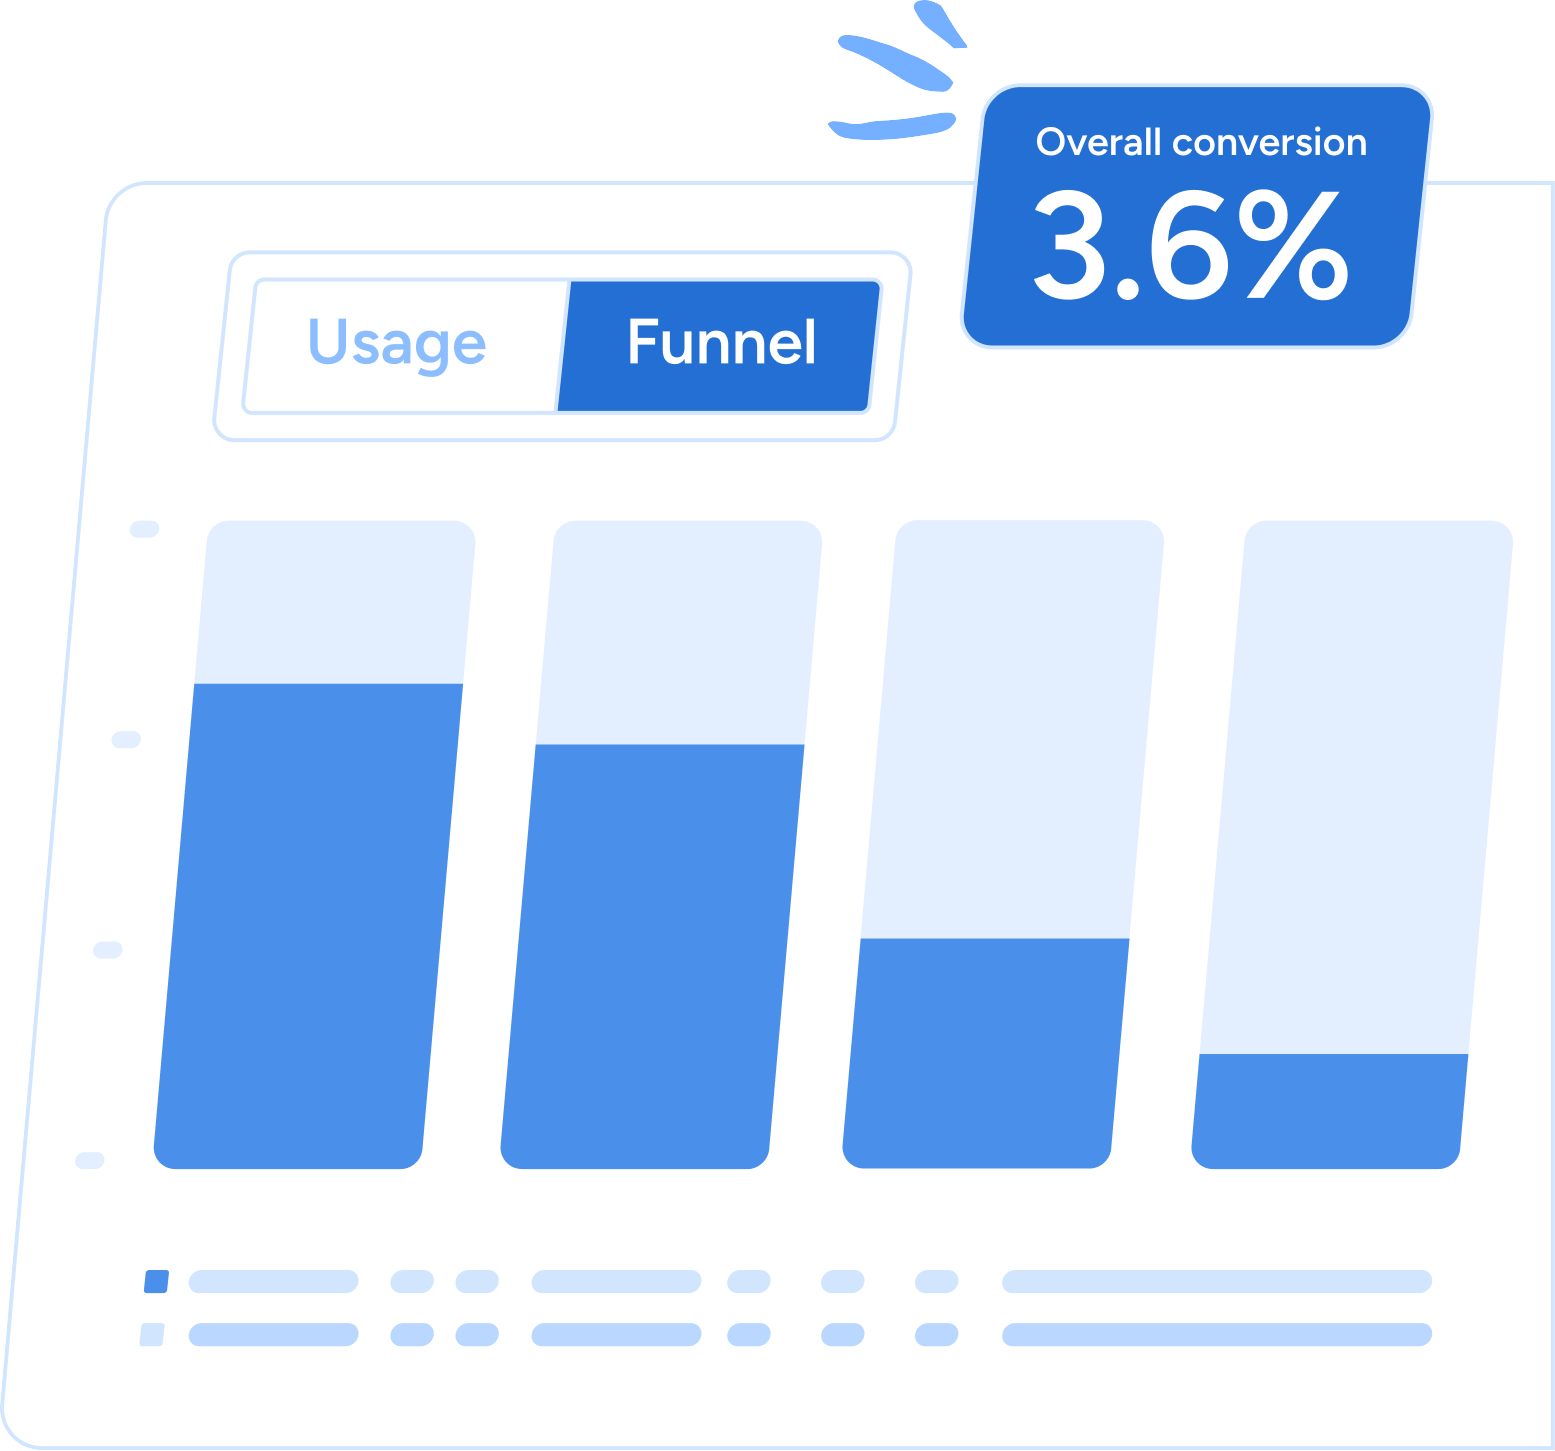
Funnel Analysis
See exactly where users fall off across any multi-step journey—signup to activation, onboarding completion, feature adoption, upgrade. Not just the drop-off rate, but the specific step, the specific segment, the specific moment where friction is highest. Then act on it without leaving Userflow.
Custom Dashboards
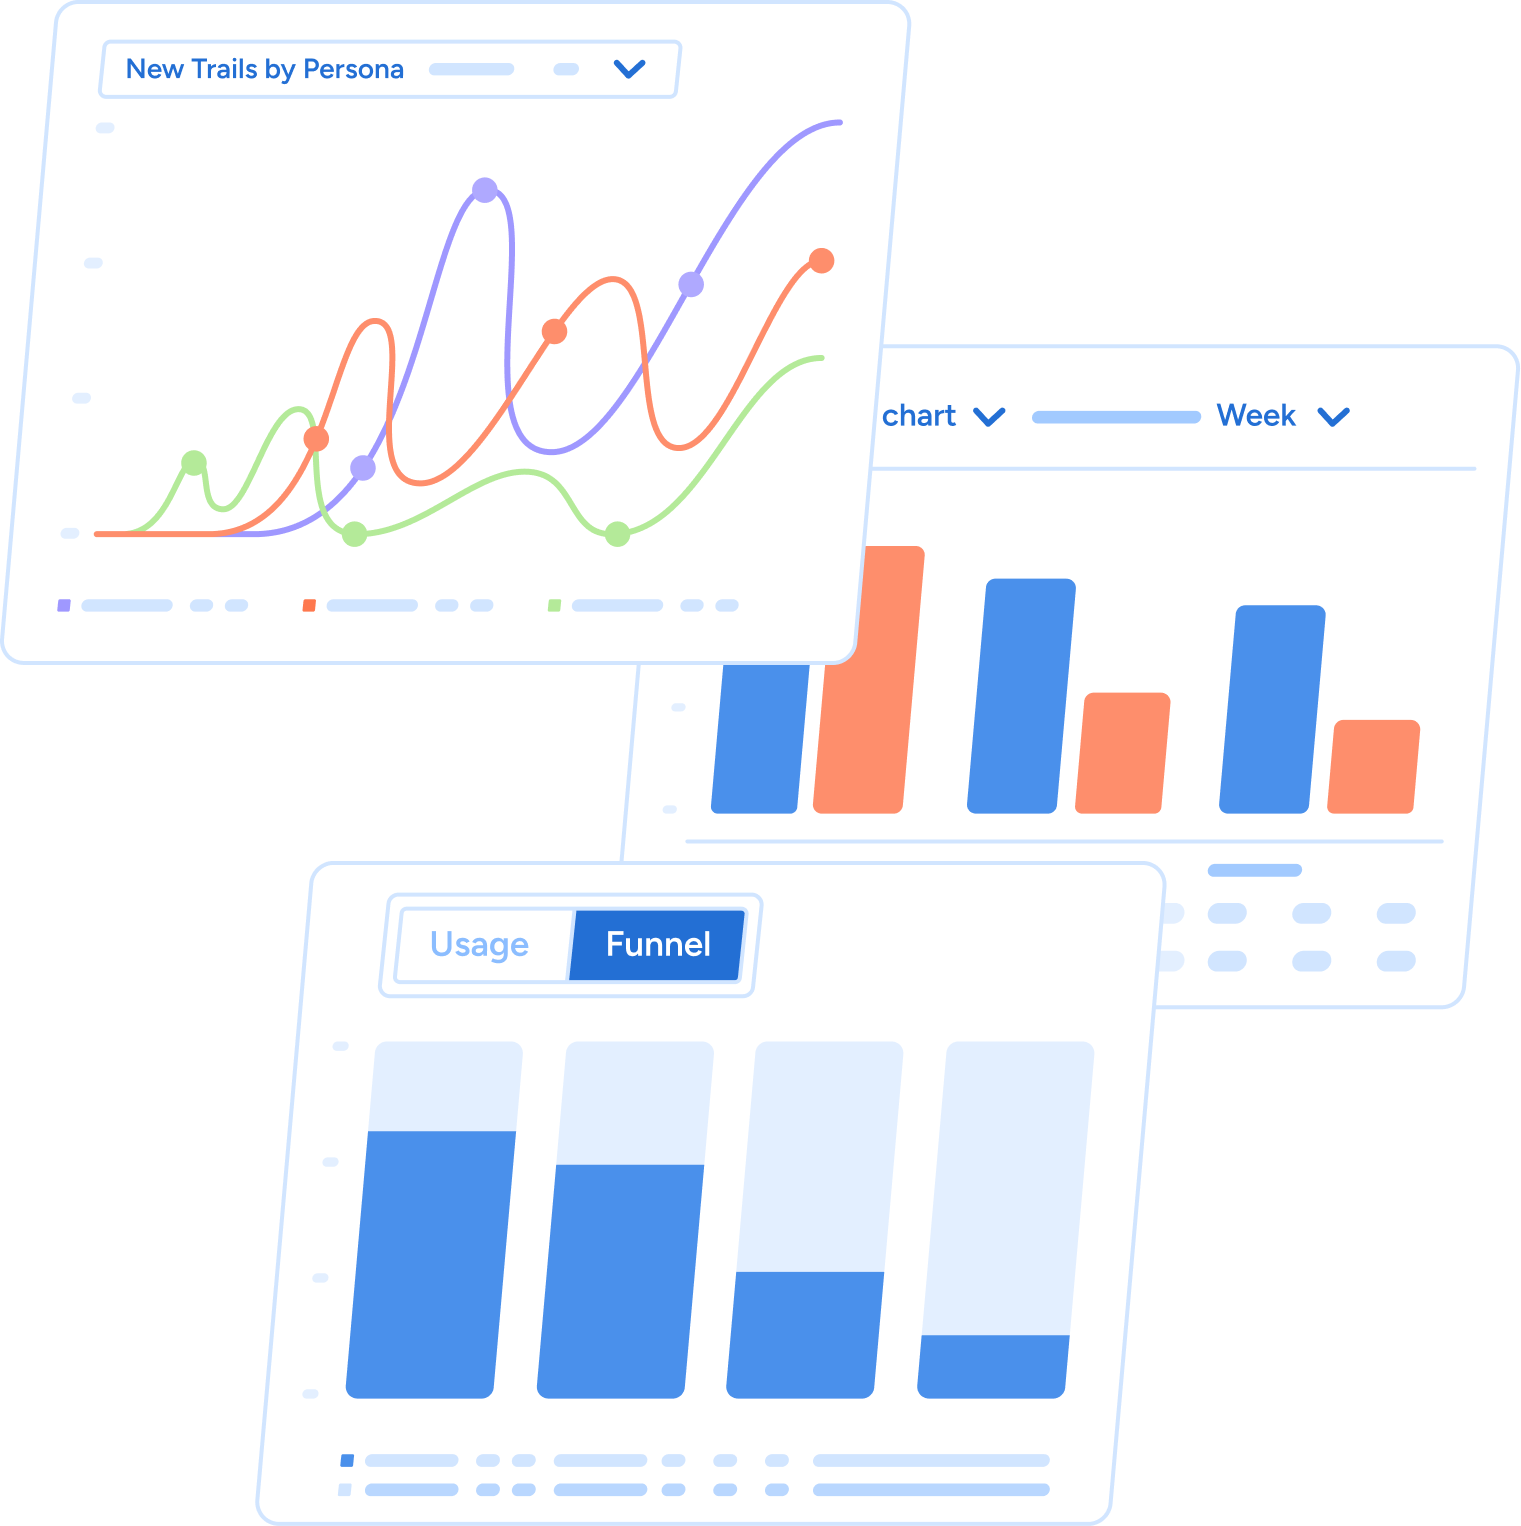
Combine charts, funnels, and adoption metrics into a single shared view of product adoption health. Build a dashboard for your team's weekly review, for a specific customer account, or for a stakeholder who needs a high-level read without the noise. One screen instead of four tools.
How Do You Go From Funnel Drop-Off to a Live Fix Without Engineering?
Because insights and experiences live in the same platform, the path from "users are dropping off here" to "a targeted fix is live" never requires a ticket or a developer.
Every chart and funnel in Product Adoption Insights supports direct CSV export of the underlying user or company list.
That might sound like a small detail. It isn't.
It means that when your funnel surfaces a cohort of users who dropped off at a specific step, you don't copy that data somewhere else to act on it. You export the list and trigger a targeted email campaign or an in-app flow—right from the same view where you found the problem. The time between "we should do something about this" and "this is live" shrinks from days to minutes.
This is the workflow gap that has quietly cost product and growth teams more than they realize. Analytics tools are built to surface information. They're not built to do anything with it. Product Adoption Insights is built for both.
Which Teams Get the Most Out of Product Adoption Insights?
The teams getting the most value from Product Adoption Insights tend to look like this:
Product Managers who need to understand feature adoption and diagnose onboarding friction without waiting on a data team. With no-code event tracking and Chart Builder, they can instrument events, build views, and answer questions the same day they come up.
Customer Success Managers who want to catch at-risk accounts before they churn. Group-by Analysis makes it easy to identify which accounts have low engagement, filter by plan type or subscription status, and trigger targeted outreach or in-app guidance proactively—not reactively.
Growth and PLG teams focused on activation and trial-to-paid conversion. Funnel Analysis shows the exact steps where trial users fall off. Group-by shows which behaviors correlate with conversion. Custom Dashboards keep the full activation funnel visible without switching tools.
None of these workflows require engineers, analysts, or a second platform. That's the point.
Why Does It Matter That Insights and Experiences Live in the Same Platform?
The reason Product Adoption Insights works differently from standalone analytics tools isn't the features themselves—it's where they live.
Because insights and experiences are in the same system, the data that surfaces in your funnel is the same data that powers your segmentation. The event you track today is the trigger condition for a guide tomorrow. The cohort you identify in a chart is the audience for a personalized onboarding flow tonight.
There's no data mapping, no integration maintenance, no lag between what you know and what you can do. The loop between insight and action is closed by default.
Availability
Chart Builder, Funnel Analysis, Custom Dashboards, and Group-by Analysis are available on all Userflow plans today.
No-code event tracking is available on all plans. Starter includes one event tracker; Pro and Enterprise include unlimited event trackers.
FAQs
Q: What is Product Adoption Insights?
A: Product Adoption Insights is a suite of no-code analytics tools built directly into Userflow. It includes event tracking, funnel analysis, chart builder, group-by analysis, and custom dashboards—all in the same platform teams use to build in-app experiences.
Q: Do I need engineers to use Product Adoption Insights?
A: No. All features, including event tracking, are no-code. You can instrument events, build funnels, and launch targeted in-app flows without filing a ticket or involving a developer.
Q: Which Userflow plans include Product Adoption Insights?
A: Chart Builder, Funnel Analysis, Custom Dashboards, and Group-by Analysis are available on all plans. Starter includes one no-code event tracker; Pro and Enterprise include unlimited event trackers.
Q: How is Product Adoption Insights different from a standalone analytics tool?
A: Standalone analytics tools show you where users drop off but can't act on that data. Because Product Adoption Insights lives inside Userflow, you can go from identifying a drop-off to launching a targeted in-app fix without switching platforms.
See It for Yourself
Product Adoption Insights is live today.
See where your users are dropping off, understand what's driving adoption, and act on it—all inside Userflow.

%20copy%207.png)
%20copy%202.png)