You’ve launched a product tour or checklist. It should be guiding your user through key steps, but, for some reason, it’s not starting for them.
Now what?
In the past, you might have filed a support ticket, waited for an investigation, then gone back and forth trying to solve the issue. And of course, all the while your customers are jumping ship because your onboarding isn’t working.
Enter Userflow Debugger - one of our most requested features. That’s right, folks, we’re starting launch week with a banger.
With this, you can skip the waiting game and see exactly why a flow isn’t triggering, without needing to contact support.
What Is the Userflow Debugger?
The Debugger is a Chrome extension built to help you instantly understand what’s happening with your flows.
Here’s what it gives you:
- Instant visibility – See why a flow is (or isn’t) starting for a given user
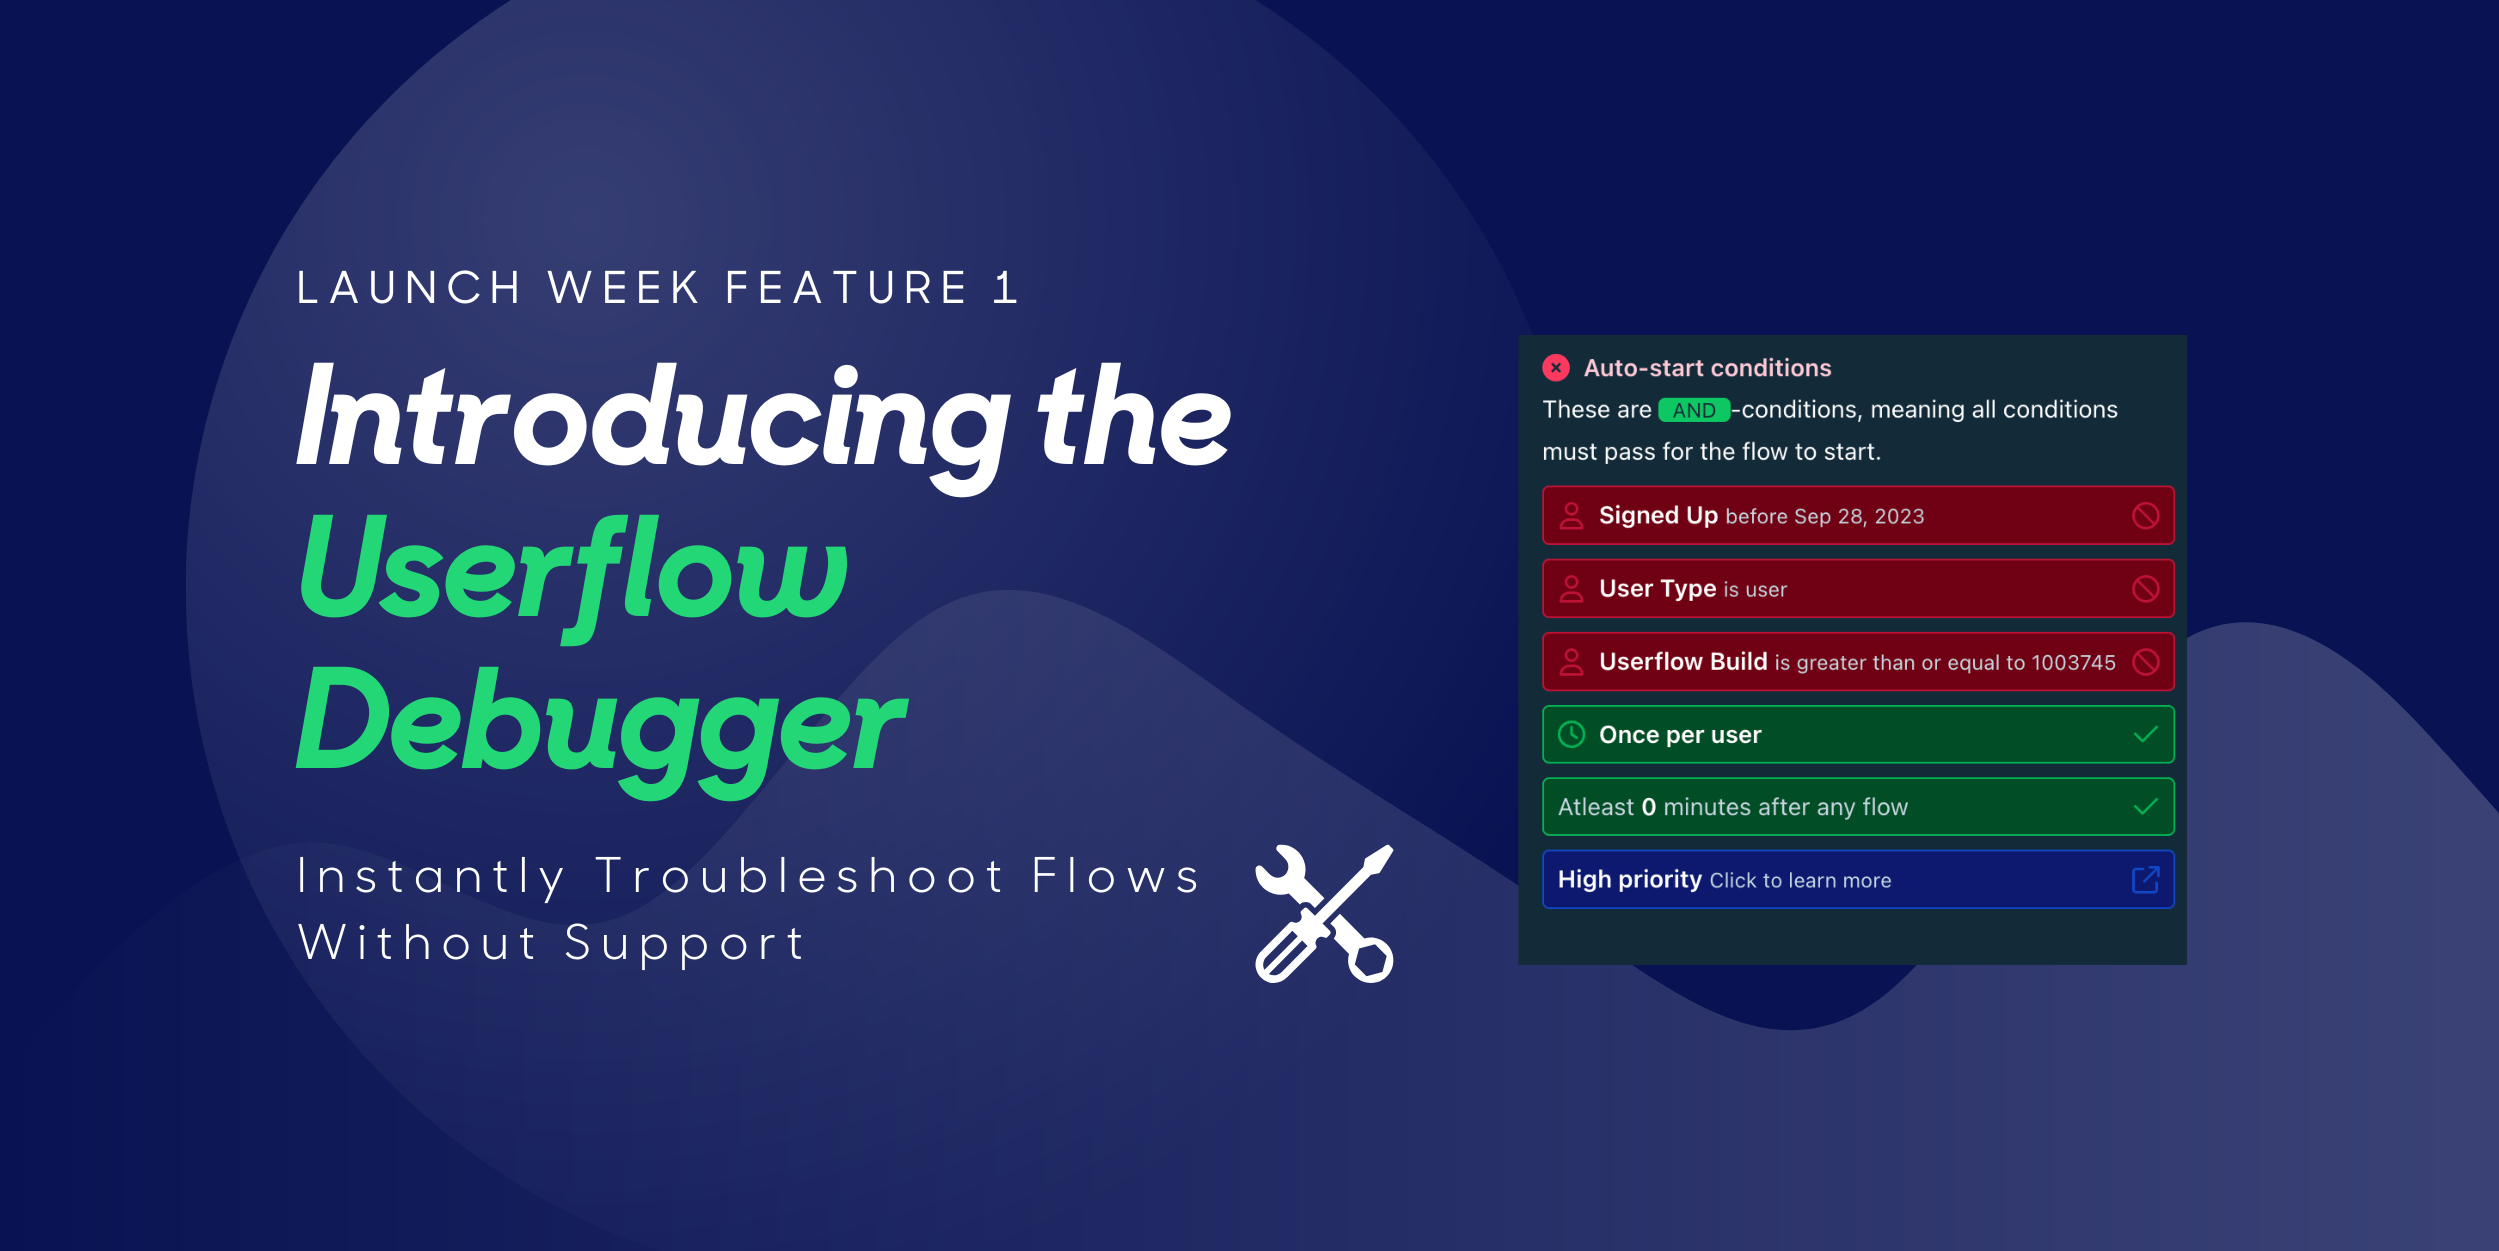
- Color-coded status pills – Instantly spot what’s passing, failing, or waiting
- Full targeting breakdown – Check attributes, events, pages, segments, delays, and more, in one place
- Trigger precedence insights – Learn which flow takes priority if multiple match
- Faster fixes – Make changes and verify them on the spot. No waiting for support
How It Helps You
Simply put, the Debugger isn’t just a huge time saver. It empowers your team.
- Resolve issues fast – Diagnose flow behavior without waiting for support tickets to be reviewed
- Deliver smoother onboarding – Spot and fix blockers before they impact new users
- Speed up testing and QA – PMs and CS teams can test visibility logic live
- Empower non-technical teammates – Give everyone the ability to self-troubleshoot
How to Start Using the Debugger
Getting started is simple:
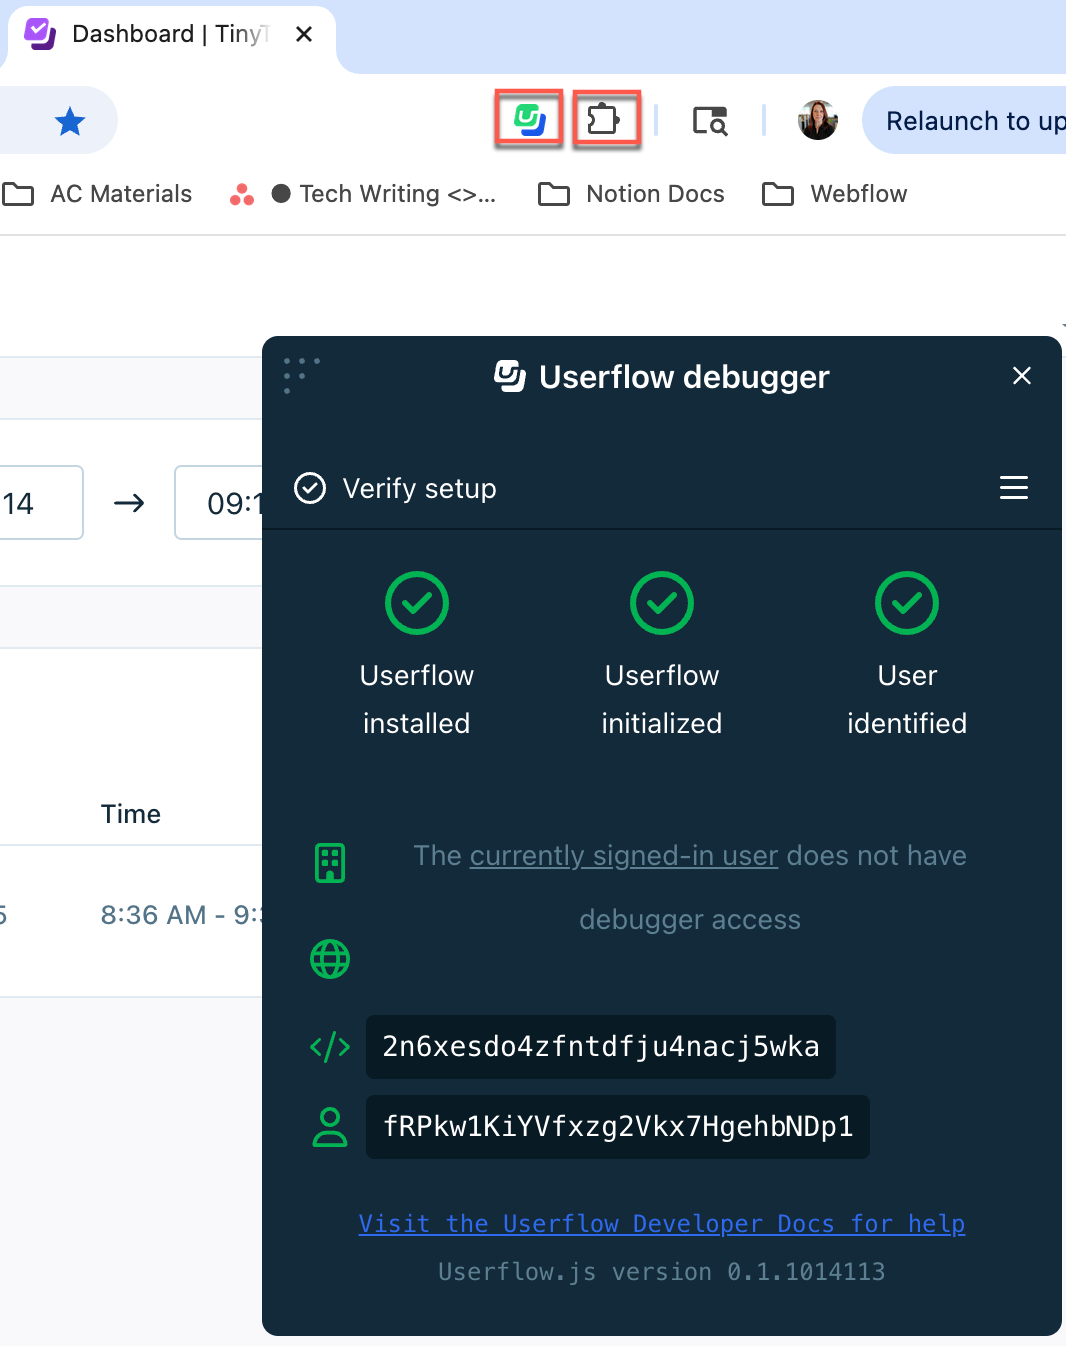
- Open your app in Chrome and launch the Debugger from the Userflow Chrome extension
- Grant access to the user you want to debug (via Settings > Debugger or directly in the extension)
- In the Debugger menu, click Check auto-start and select the flow you want to investigate
- Review the color-coded status pills to see which conditions are passing, failing, waiting, or blocked
- Adjust your flow’s auto-start conditions or app setup as needed
- Re-check in the Debugger to confirm the issue is resolved and the flow triggers as expected
Find out more on our help doc
Take Full Control of Your Flows With The Debugger
At Userflow, we’re constantly building features to make flow creation, testing, and optimization faster and easier. The Debugger is a big leap forward — giving you instant answers and more control over your onboarding experience.
Already a Userflow customer? Try the Debugger now and see how much faster your troubleshooting can be.
Not using Userflow yet? There’s never been a better time to start. Sign up for a free trial and experience no-code onboarding flows you can build, test, and debug in minutes.
Sign In / Start Free Trial
PS. Need to extend or reactivate your Userflow trial? Email support@userflow.com and we’ll get you set up so you can explore our Launch Week features.

%20copy%208.png)
%20copy%205.png)